In many companies, the monthly budget allocation is determined by simply dividing the annual budget by twelve. For example, if the annual advertising budget is $60,000, the monthly budget will be $5,000.
If your company uses this approach, be aware it has some serious disadvantages if the business somehow depends on seasonality—if you experience alternating periods of falling demand and increasing demand.
First, in the “dead” months there may be a budget underspend.
Let’s look at one example.
Let’s say February is the “hottest” month for your business, and you divide the PPC budget into twelve equal parts.
How Can Kraftblick Help Your Software Company?

- We build marketing strategies from scratch and fix existing ones. More about that here.
- We provide consultations to company owners, directors, heads of marketing and sales, marketers. This is how we do it.
See you soon 🙂
In February the budget would be spent completely, and in all other months the budget would not be fully spent:
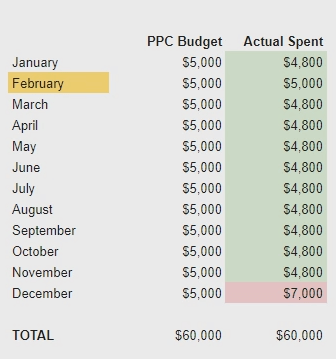 In the end, there will be $2000 left.
In this case, the department would have to swiftly—and ineffectively—spend the $2,000 remaining from previous months to avoid seeing the company allocate less money for next year’s budget.
Secondly, during hot months, the budget may run out too quickly.
Let’s consider another example.
If, in normal months, the budget is fully spent by the end of each month, in hot months it’s likely the budget will get eaten up much earlier:
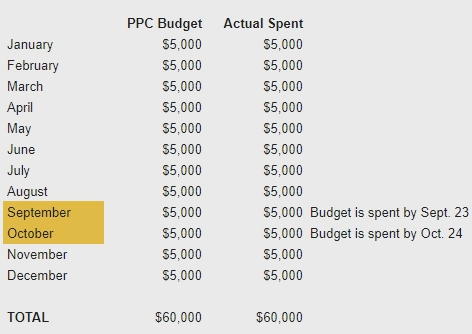 If the monthly budget of $5,000 is fully utilized in normal months, it won’t be enough during a “hot” month.
This means you’ll miss a lot of leads at the best time of the year for sales.
“[In AdWords] every single click represents either business growth or your hard earned cash becoming kindling,”
believes Allen Finn, the famous marketing expert and blogger.
In this article, we’ll explain why it’s important to make sure your monthly budget reflects the seasonality of your business.
We’ll also show you, step by step, how to do accurate calculations that will help you boost leads without any additional spending.
Active Advertising is Crucial in the Hot Season
Which seasons are hot depends on the business, but whatever your product or service, this refers to a time when both product demand and the percentage of conversions grow rapidly.
In average periods, your conversion rate might look like this:
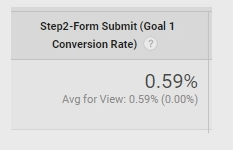
In the hot season it’s likely to look like this:
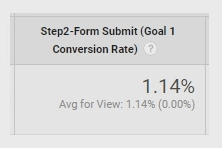
The difference means that by properly allocating your budget, you’ll be able to generate a lot more leads without exceeding your annual cost.
So you just need to find out which months could be termed hot for your business, and correctly allocate the budget based on this knowledge.
As Tereza Litsa, the marketing expert and contributor at Search Engine Watch says,
“Your PPC budget strategy is all about focusing on the best-performing ads while constantly reviewing performance to make sure you are allocating resources in the most effective ways.”
How to Determine Seasonality For Businesses
Let’s use the example of a company that produces tax software.
It’s a good example because American companies file tax returns in certain months of the year. Interest in such software peaks in those particular months.
Here’s the process.
- Open Google Keyword Planner
Press “Get search volume.”
- Enter the keyword that characterizes a business
Now we get the volume of the “tax software” keyword:
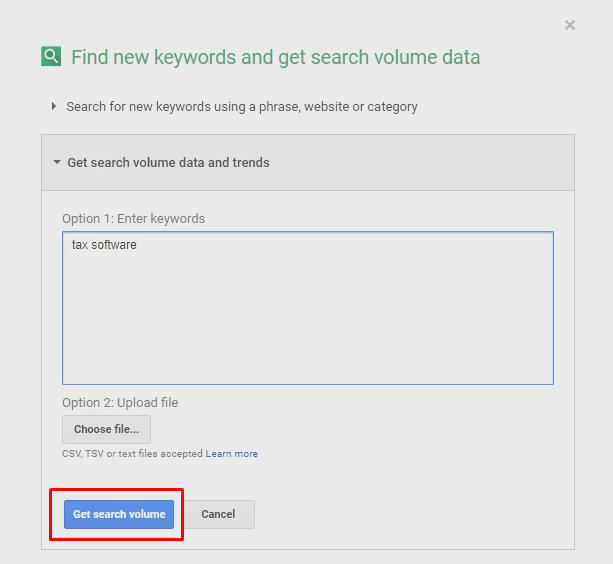 Enter a keyword and click on the highlighted button.
Thus, we get statistics for the past 12 months:
 By default, Google Keyword Planner shows statistics for the past twelve months.
Note from this that the hottest months for this search query are January and February, with a gradual decline in interest in March and April:
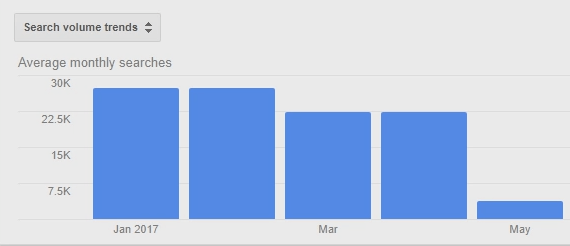 In April everyone submits returns. In later months, the need for such software shrinks.
Now you can take one more step to make sure that the statistics are correct, and that increased demand in certain seasons of the year is not mere coincidence.
- Open statistics for the past four years
To do this, go to the “date range” section on the left side of the screen and set the parameters. It is best to select statistics for several years, so you can be sure the jumps in demand are not a coincidence:
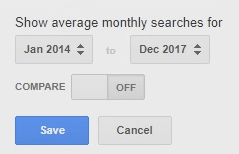 Google Keyword Planner allows you to view statistics for a maximum of four years.
We get a graph that looks something like this:
 Every year, consumer demand fell around May and began to grow in the post-December period.
It’s obvious that the jumps in demand are no coincidence and repeat every year.
With the help of this data, you can begin to understand for which months it’s worthwhile to raise the budget and what months can be considered “dead.”
A little later we’ll explain how to correctly use this data to calculate your budget.
How to Determine Seasonality In Less Obvious Cases
If this is a simple matter in spheres such as tax preparation, what about business categories in which seasonality isn’t as easy to pinpoint?
Let’s figure it out.
- Open Google Keyword Planner
For now, we need to do everything the same way as in the previous section, except that we will use a keyword whose seasonality will be harder to define, such as “productivity software”.
- Enter a keyword that characterizes a business
Open statistics for the “productivity software” keyword.
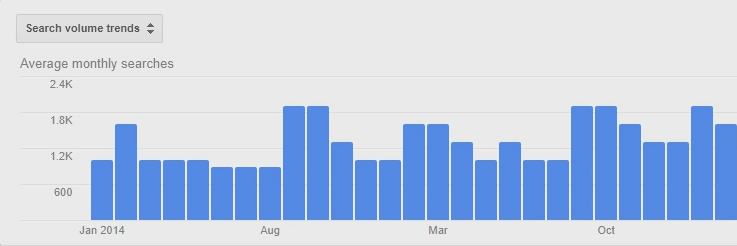 We can see that data varies year by year, without obvious hot or dead months.
To get more clear and useful data, we’ll have to work with it a little more.
Now, the good old Excel will help us:
- Export statistics for the last few years in the Excel format
Note: This method works only in niches with more or less stable demand, when there is no sharp growth or fall in demand over the past few years.
For fields such as mining software, for example, this method would be useless.
If we enter the “mining software” keyword in Google Keyword Planner, we will see such a graph:

We see that these tools were not popular until 2017, when there was a real jump in demand:
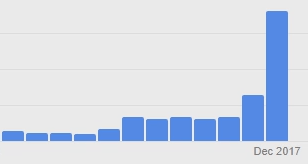
It is difficult to determine seasonality with such statistics. There is one way to do it, but we’ll talk about in another article.
Now let’s return to our “productivity software” keyword.
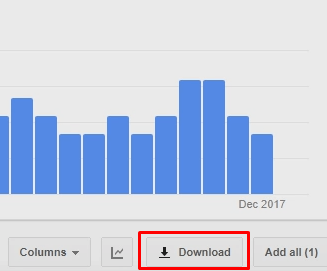
We already got statistics in Google Keyword Planner; now we need to export those statistics. Click “Download”:
Then select the file format and download it:
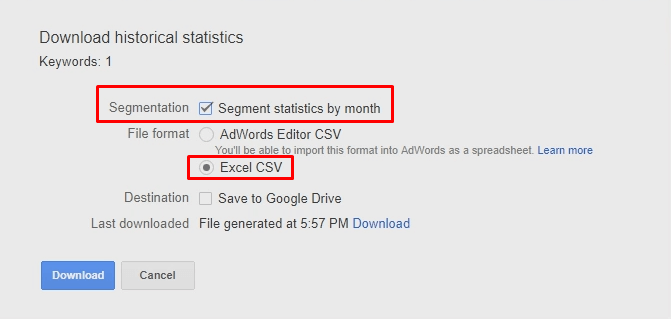 Be sure to put a check next to the “Segment statistics by month.” Without this, the data may be incorrect.
And open the downloaded file:
 Here we see the number of searches with our keyword for every month.
- Create a spreadsheet on the Google Drive
Make a spreadsheet like this:
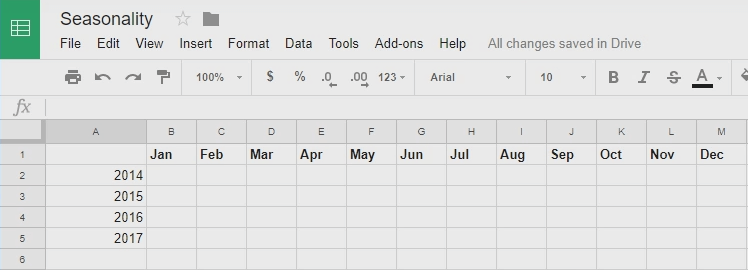 Input the years and months for which you have statistics in this spreadsheet.
- Copy the data from Excel into the Google Drive spreadsheet
Copy the data:
 It’s often best not to copy everything at once; it may be more convenient for insertion to copy data for twelve months at a time, four times.
And transfer the data into the Google spreadsheet:
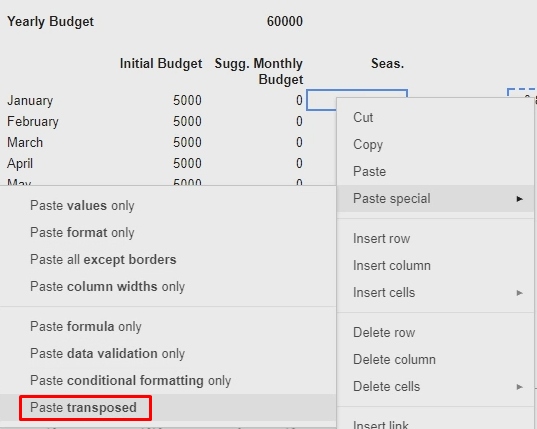
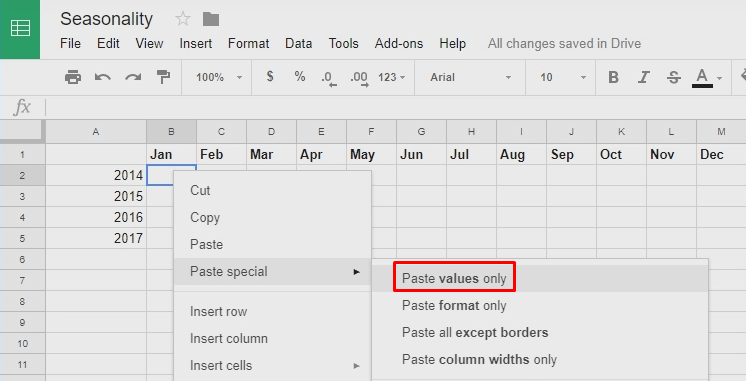 You need to click here to transfer the data correctly.
Thus, we get the data for the first of four years:
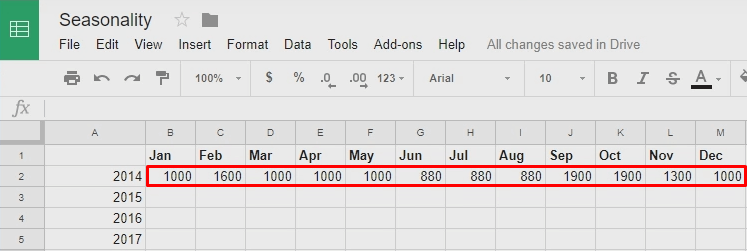
Repeat this process for the remaining three years of data, pasting into the Excel file as you go. You’ll get a spreadsheet something like this:
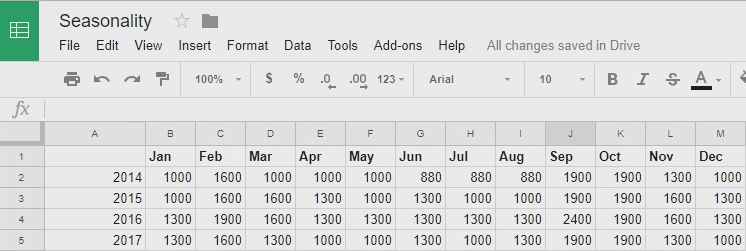 We collected the data for four years in one Google spreadsheet.
- Count the average number of searches per month
Now it’s time to count a little. To start, add one column to the Google spreadsheet:
 You can name this column whatever you like.
Use a formula to sum all the numbers:
 Input this formula and select all the numbers in this row.
Press “enter” and get a total for the row:

Then extend the formula to all the rows of this column:
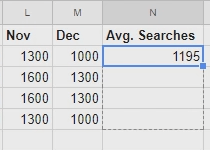
And get totals:
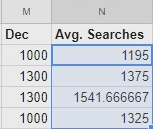
You can remove annoying extra numbers after the point, by doing this:
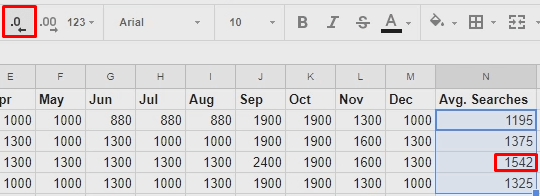 Select the cell with the figure you want to shorten and click on the highlighted icon on the left.
Now one step remains to determine the seasonality of the business.
- Count the coefficient of seasonality for each month
First, create one more row in the Google spreadsheet:
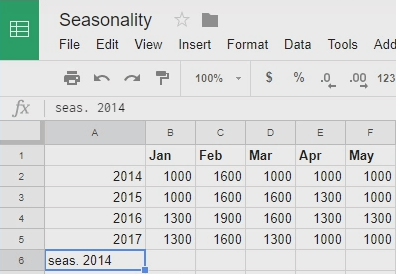
And extend it three rows down:
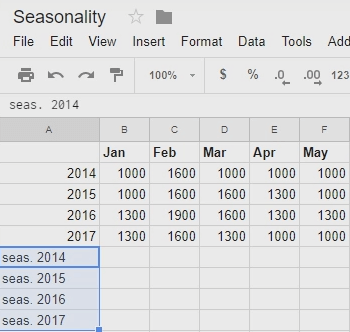 Just select the first line, drag it down, and Google will do all the job.
Then enter one formula into the red cell:
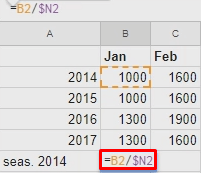
The formula will divide the number of searches in this particular month by the average number of searches a year:

Press “enter” and get a figure like this:
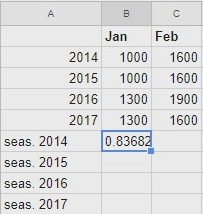
Now extend the formula for all the years and month in your data:

These figures represent the seasonality coefficient for every month of each of the four years:
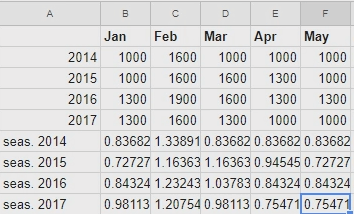
All that’s left to do now is calculate the average seasonality coefficient for each month. Create one more row:
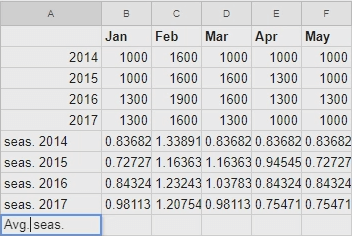
And use this formula:
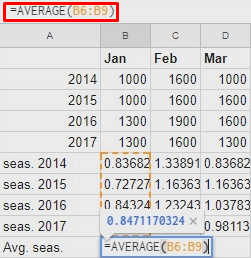
This gives you the average seasonality coefficient for a particular month of the year:
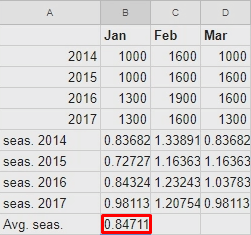
Extend that process to all months:

For convenience, you can also remove extra digits in cells:
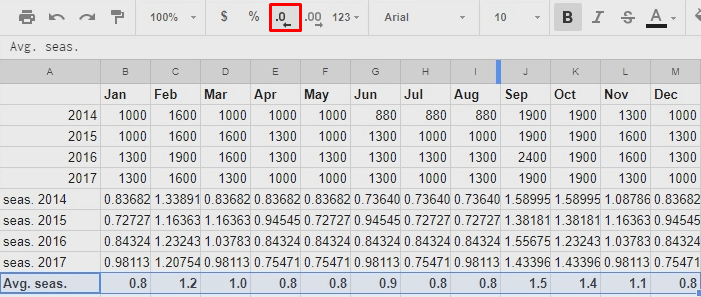 Just click on the highlighted button a few times.
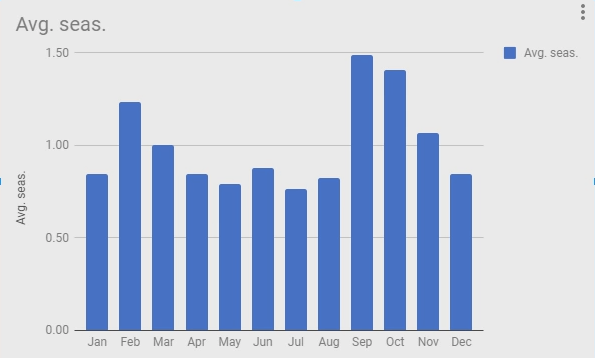
Now we have the average seasonality coefficient for all months.
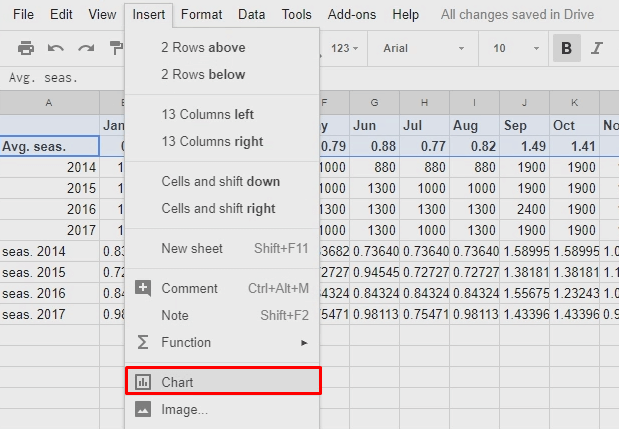
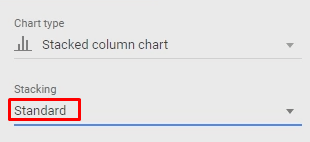
- Build a graph with all the seasonality data
How to Estimate Budget Breakdown on Seasonality
The first thing to do now is:
- Copy the seasonality coefficients into the spreadsheet
First, make a Google spreadsheet like this:
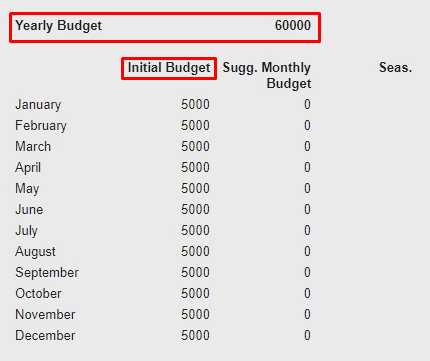 Let’s go back to the example from the beginning of the article. Your annual budget is $60,000, and the monthly one is created by dividing annual budget by twelve.
Then copy the coefficients you came up with in the previous steps:

Paste them into the new spreadsheet:
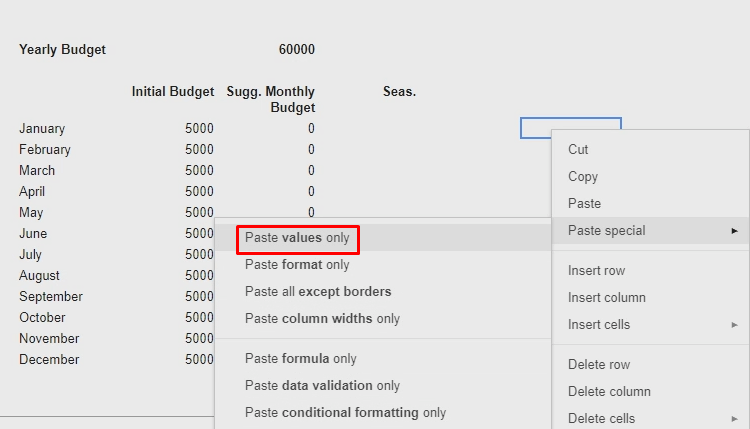
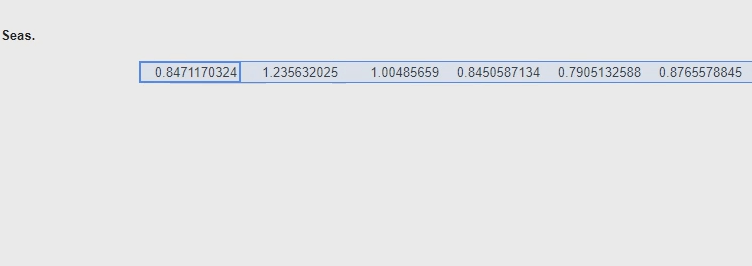
Select and copy them all:
And paste the coefficients into the third column:
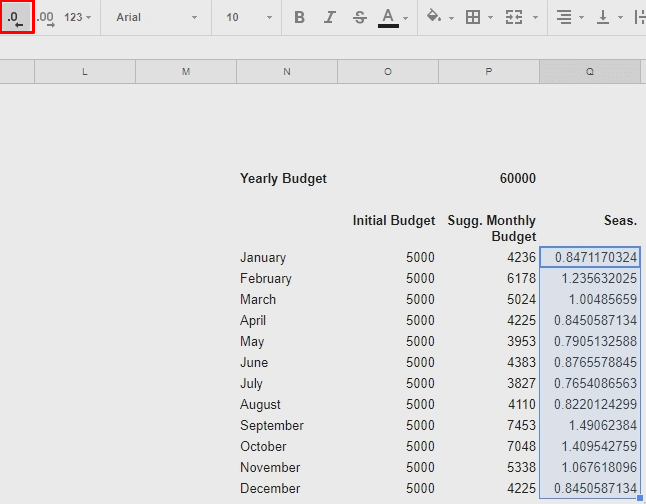
Remove the extra digits:
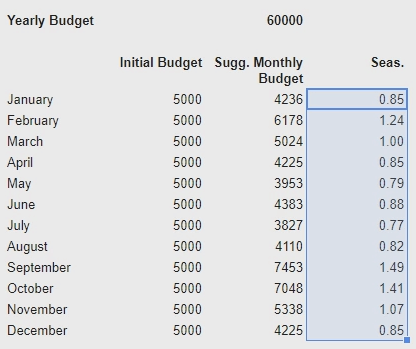
And get a spreadsheet that looks like this:
The last step is to get the final result.
We enter this formula into the second column:
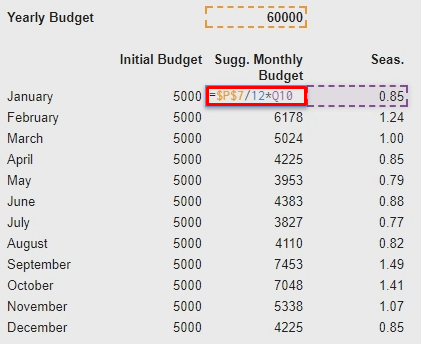
The formula divides the total annual budget by twelve and multiplies it by a seasonality coefficient.
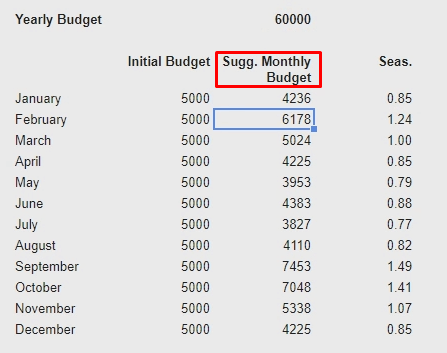
This gives us the new suggested monthly budgets, which will maximize the impact of every dollar:
If you want, you can also build a comparative chart:
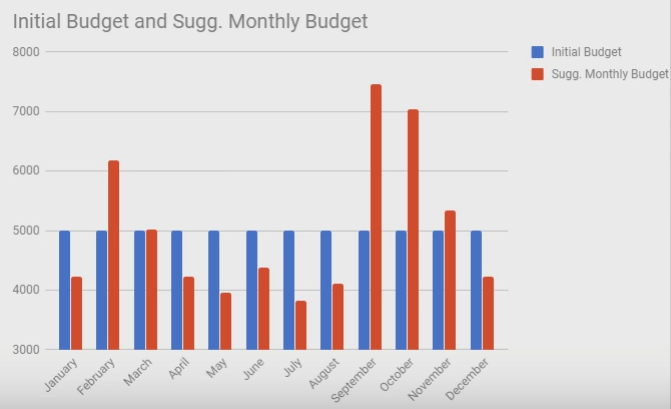 Blue shows the initial budget, red the recommended budget. We can see at a glance in which months the budget should be increased – or reduced.
That’s it. Now you’ve learned how to determine the seasonality of your business and distribute the budget wisely using average seasonality coefficients.
Key Takeaways
Calculating a monthly budget by simply dividing the annual budget by twelve may result in missed opportunities for leads during hot periods of the year.
What’s important is that these extra leads can be obtained without paying a penny more. You just need to know which months are the hot periods for your business, the months when the conversion rate is particularly high.
To determine the seasonality of your business and use this skill to determine the monthly advertising budget:
- Enter the keyword that characterizes your business into Google Keyword Planner
- If your business tends to some “seasonality,” use the statistics for your budget allocation
- If the “seasonality” of your business is not obvious, export statistics for the past four years in the Excel format
- Create a spreadsheet on Google Drive
- Copy the data from Excel into a Google Drive file
- Make all the calculations with the help of Excel formulas (provided in the article)
- Distribute the new advertising budget according to these calculations
All of the steps to this point are detailed in the article.
How do you allocate monthly budgets in your company? Does the seasonality of your business affect the budget allocation?
*The article is prepared (structured and formatted) by Roman Davydov.


