Last year, we decided to master a new genre of articles: data-backed posts.
We knew about their potential, and how viral they can become, from looking at examples on the Internet.
For example, this brilliant data-backed article by Scott Brinker got more than 6,000 shares over several years.
So we wrote a data-backed article for our client—a company that offers display ad technology and a competitor research tool—and the results were very good. The article became one of the most popular, according to our data from Google Analytics.
But as the article was being written we faced several significant difficulties. Fortunately, we were able to overcome them.
How Can Kraftblick Help Your Software Company?

- We build marketing strategies from scratch and fix existing ones. More about that here.
- We provide consultations to company owners, directors, heads of marketing and sales, marketers. This is how we do it.
See you soon 🙂
What We Did
We persuaded our client to write a data-backed article for his blog to get leads and simultaneously advertise the client’s product.
“While a story can make your post more persuasive and memorable, data can often accomplish the same thing,”
says Alex Turnbull, CEO of Groove.
The client’s product collected large amounts of data about display ads, so we decided that a data-backed post based on customer data would be unique and would bring value to advertisers (the client’s target audience).
Since our client was a company that offers competitive intelligence software for display advertisers, we decided to write a research-based post to tell advertisers which banner sizes they should go with when time is limited, and why they need to launch ad campaigns quickly.
In these situations, advertisers don’t have a chance to design banners in all sizes, even though this is usually the best option. In the article, readers were told which banner sizes always work well, and which should be used first.
After the client approved our idea, we started researching, gathering and analyzing data.
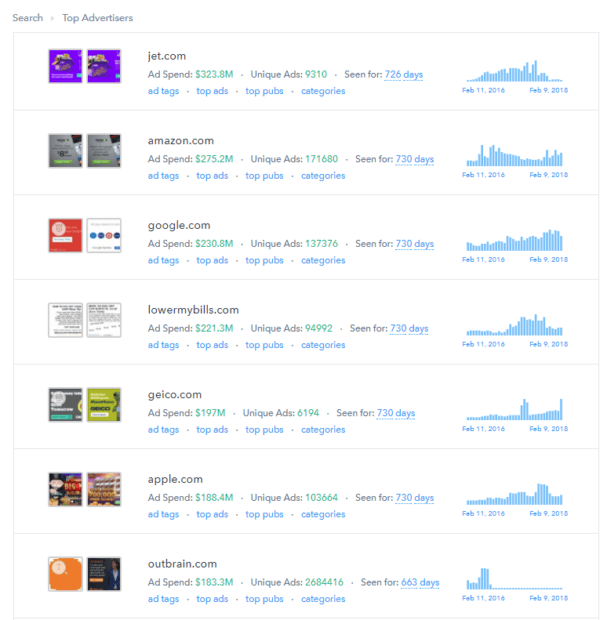
During our research, we analyzed more than 40,000 banners spanning a total budget of over $6 billion.

We looked at advertiser profiles with an estimated spend of at least $3,000 on each of these banners over the last two years using our client’s tool.
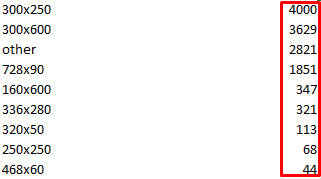
We researched which banner sizes have the largest Impression Shares according to Google data.
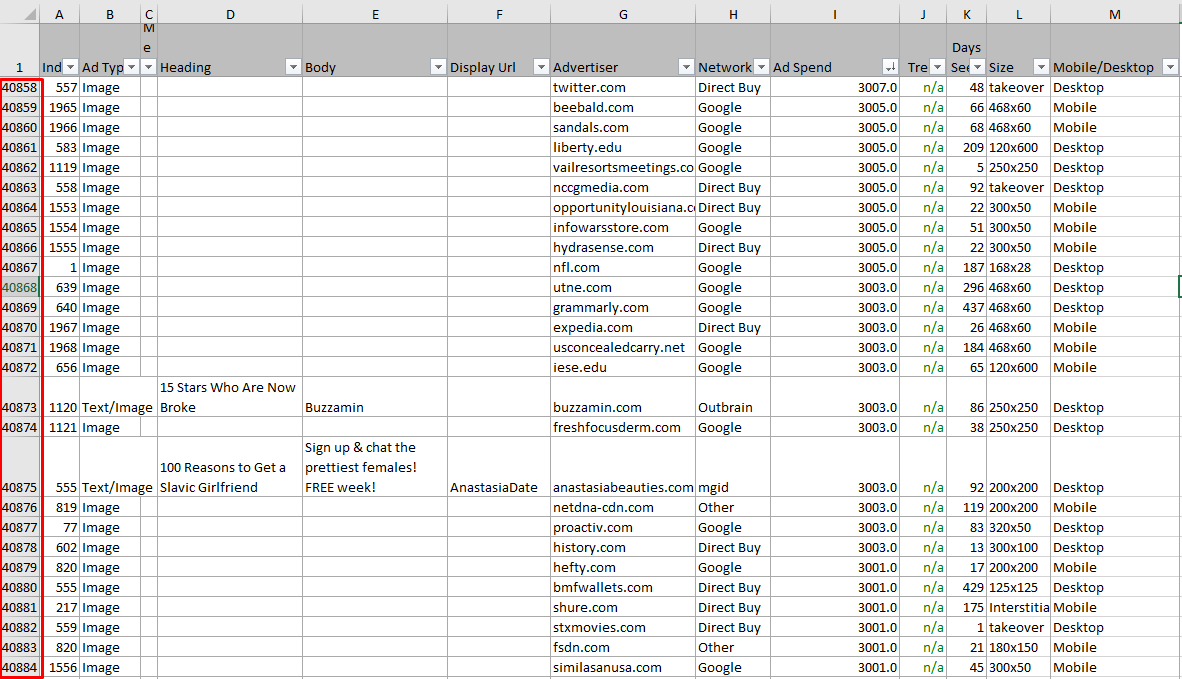
Then we exported 40,000 banners from the client’s tool and analyzed them with Excel.
We examined which banner sizes are most suitable for use on the largest number of advertising networks by looking through all the banners with the help of the “Ad Networks” parameter.

With the help of this parameter, we learned how many banners of different sizes were used by advertisers in different ad networks.
We also found out what banner sizes advertisers consider the most effective.
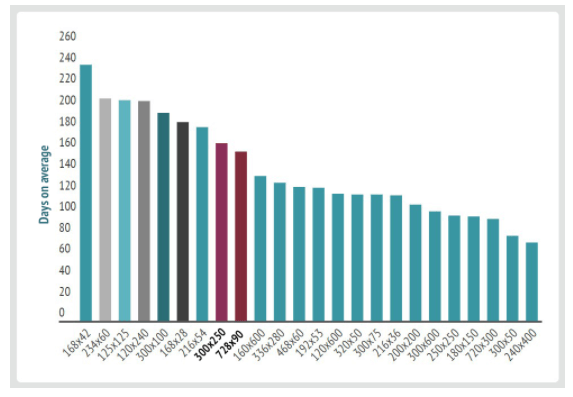
We looked at how much money advertisers spent on specific sizes, and how many days on average each size ran for two years. (We used the “Ad Spend” and “Days Seen” parameters in Excel.)

For example, that’s how we checked how much money advertisers had spent on this or that banner size.
Based on all of this data, we wrote an article. With the help of data analysis, we gave advertisers some practical and data-backed advice on which banner sizes they should go with when they need to launch an ad campaign quickly.
For example, we’ve stated that the 300×250, 728×90, and 160×600 sizes are a must-have because they ideally suit many ad networks.
Similarly, we’ve said that 300×100, 300×50, and 320×50 are good choices for ad campaigns on mobile.
For convenience, we submitted the most valuable information in the form of graphs.
Now, while the description of the writing process may make it seem like it was simple, we can tell you that from the inside that everything was not so easy.
What Problems Did We Encounter and How Did We Solve Them?
Now l will share the issues we faced when we wrote the data-backed post, and how we fixed them.
Issue #1: we did not allocate contingency time in case the writing process took longer than anticipated
At around the time the article had to be completed, we noticed a few errors in the calculations—mistakes sometimes occur when you have to operate with large data sets.
We, therefore, had to reanalyze some data.

The amount of data we analyzed
But this meant that we could miss our deadline. Clients hate when agencies do not meet deadlines.
“If you miss a deadline, it’s easy for all the trust you’ve earned to be quickly disregarded,”
rightly states Jami Oetting, HubSpot’s content strategy team leader.
Fortunately, we found a way out by allocating some of our internal company resources to work on the article.
What the problem could have lead to:
Missed deadlines and a dissatisfied client.
How we solved the problem:
We assigned a staff designer to help the writer.
She relieved the writer of the need to embed images in the article, thereby allowing the writer to redo all the necessary calculations and finish the article on time.
What we learned from this experience:
When we start writing complex articles, we now make sure that the writer has no distractions, and the designer performs all of the article’s graphical work.
Also, before assigning deadlines for complex articles, we try to allocate additional reserve time, so that in case of unforeseen events, our writer has time for rework.
Issue #2: we began to do graphs before the article was completely written, so when the text was edited, we also had to edit the graphs

Example: the graph we made
The second problem emerged from the first one.
The designer helped the writer and made all the graphs, but we did not take into account the fact that the text had not yet been approved by the editor.
After the editor checked the final version of the article, we had to remove a couple of sections from the text. This meant that we also had to change the graphs—which created another pressure on our deadlines.
In this case, the diligence and conscientiousness of our employees helped us.
What the problem could have led to:
Being late with the release of the article, making our client dissatisfied.
How we solved this problem:
Our writer and designer stayed late at work, allowing us to redo all the graphs on time.
What we learned from this experience:
We create graphs only when the article is completely written and the text itself has passed all checks.
This helps avoid wasted time in case our editor asks for corrections to the text of the article.
Issue #3: we did not make the article’s headline and pitch “catchy” enough
At first, only a few readers read the article.
Of course, a variety of factors can play a role here, but we felt that a key factor was the insufficiently attractive article title.
As Jeff Goins, the famous blogger and content marketing expert, says,
“In a world full of noise, how do you get people to read what you write? It takes more than good content or great design. The most important part of writing an article is the headline.”
The heading did not reflect that the article was based on data, even though the whole point of the article was that we had conducted extensive research to add value to it.
So readers couldn’t see the article’s value, and did not show any interest in reading it.
What the problem could have led to:
The article not being noticed, and missing many leads.
How we solved this problem:
We checked the analytics and saw that the article had few views.
We decided to rename the article and also change its pitch. In particular, right in the title, we indicated that the article was based on data and the analysis of thousands of banners.
Immediately after that, the audience’s interest in the article grew noticeably, and readers began to share the article in social networks.
What we learned from this experience:
We make sure that the article’s pitch is “catchy” and the headline reflects the fact that the article is data-backed.
It is very important that readers immediately understand that they have before them a useful article based on data analysis.
Wrap-Up
It’s very difficult to write articles based on data.
In addition to the writer needing to do a lot of calculations, it is also necessary to verify the data several times and check it for errors.
The writer then needs to craft an interesting and coherent story from the data, because pure data by itself does not bring any benefit.
For example, we initially thought that creation of the article would take no more than two or three days.
In fact, the whole process took about 120 working hours across four company specialists (a writer, a designer, an editor and a promoter).
Of course, the longest and most difficult work was done by the writer and the designer.
The writer spent about half the time in Excel and the designer scrupulously converted all useful data into beautiful and useful graphs.
But such hard work pays off a hundredfold. Users love reading data-backed articles because they find them very valuable.
How you ever tried publishing data-backed articles? What were the results?